News:
December 9 | 2010
We've made many small improvements including the following:
Graph Layout
Exporting
Loading Data
September 13 | 2010
We are proud to officially announce
TouchGraph Navigator 2!
Great new features include:
April 16 | 2010
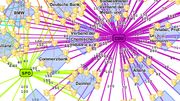
An analysis of Germany's
network of political parties and corporate donors
has been published in Die Zeit by Dr. Frank D. Behrend of Eliqos.
Dr. Behrend used TouchGraph's upcoming Navigator 2 release to create a visualization of how companies such as BMW, Deutsche Bank, and Allianz contributed to Germany's six major political parties.
An English version of the article is available via Google-translate.
December 1 | 2009
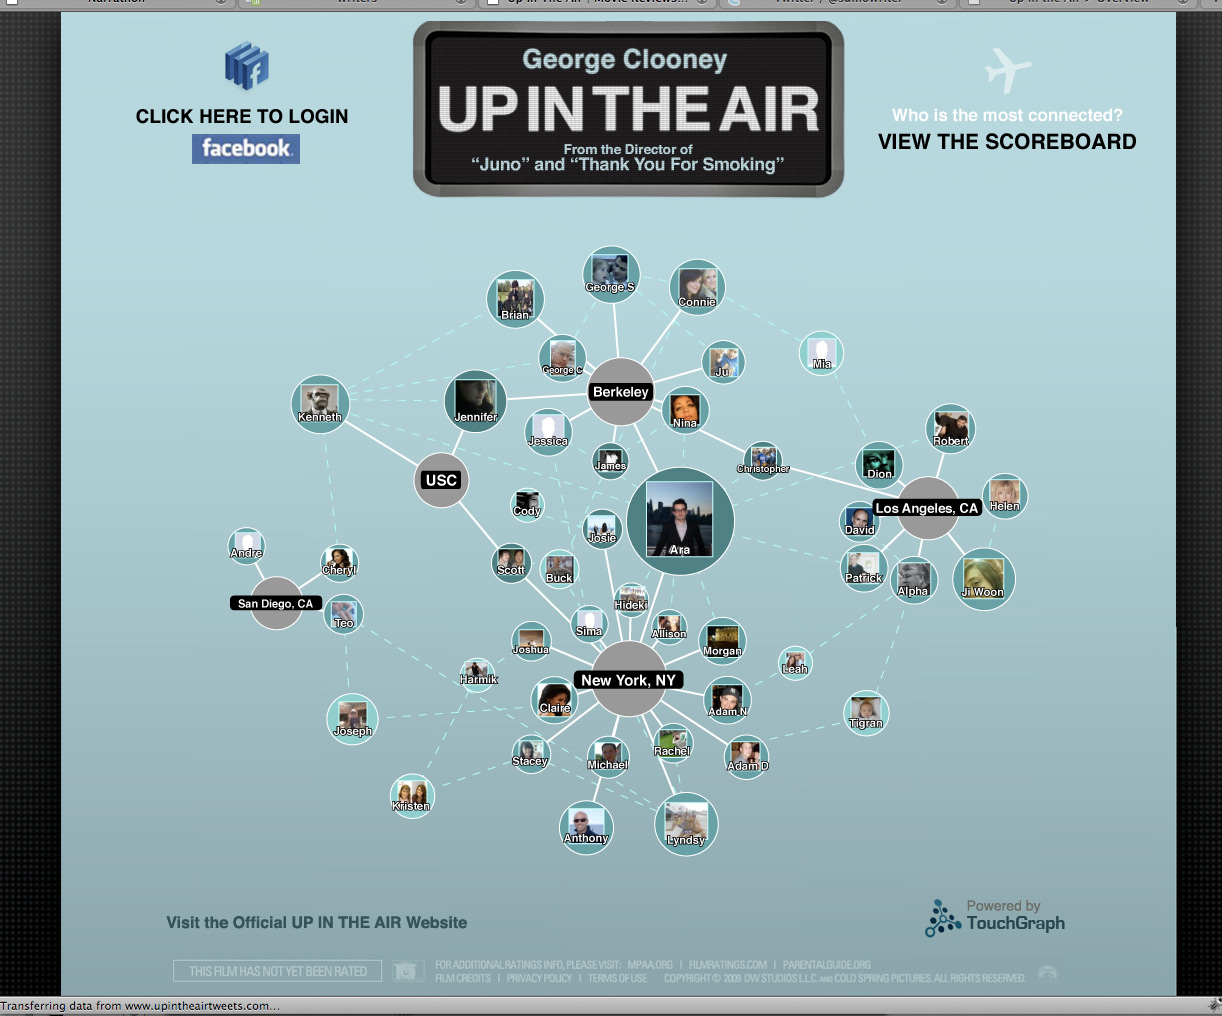
Custom look for Up in the Air movie:
The interactive marketing team at Paramount wanted to promote Up in the Air on Facebook. The tagline for the movie is
"The story of a man ready to make a connection". Paramount felt network visualization
was a good way to engage fans with this metaphore. Paramount requested that TouchGraph
customize the TouchGraph Facebook application to match the
look of the movie website.
The adjacent image shows the customized look and feel from TouchGraph's proposal.
October 8 | 2009
TouchGraph partners with the authors of CONNECTED: The Surprising Power of Our Social Networks and How They Shape Our Lives to create a custom version of our popular TouchGraph Facebook Photos application.
Renowned scientists Nicholas A. Christakis and James H. Fowler present compelling evidence for our profound influence on one another's tastes, health, wealth, happiness, beliefs, even weight, as they explain how social networks form and how they operate.
Read what CONNECTED has to say about how Obesity, politics, STDs flow in social networks on CNN.com
September 15 | 2009

The Invisible Edge by Mark Blaxill and Ralph Eckardt talks about Intellectual Property as a priority for business strategy. The authors describe how they used tools developed by TouchGraph to zoom through IP Networks.
"The picture below compares the innovation keiretsus of Toyota and Ford. The networks show the joint ownership of patents held by each company. One look and it is easy to see what was once invisible. Toyota has developed a rich network of collaborative innovation by sharing the ownership of the property rights that result. Ford? Not so much. That difference has led to dramatic differences in the performance of the two companies."
April 28 | 2009
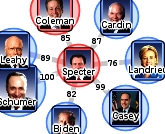
Senator Arlen Specter's switch makes sense when visualized with TouchGraph Navigator.
TouchGraph's visualization of senator co-sponsorship patterns in the 110th congress shows that he has acting like a democrat for years.
Senator Specter has co-sponsored more bills with senators Shumer, Casey, Lehey and 7 other Democratic senators than he has with senator Coleman, his closest Republican co-sponsor.
TouchGraph Navigator's senate visualization builds on James Fowler's earlier work at UC Davis.